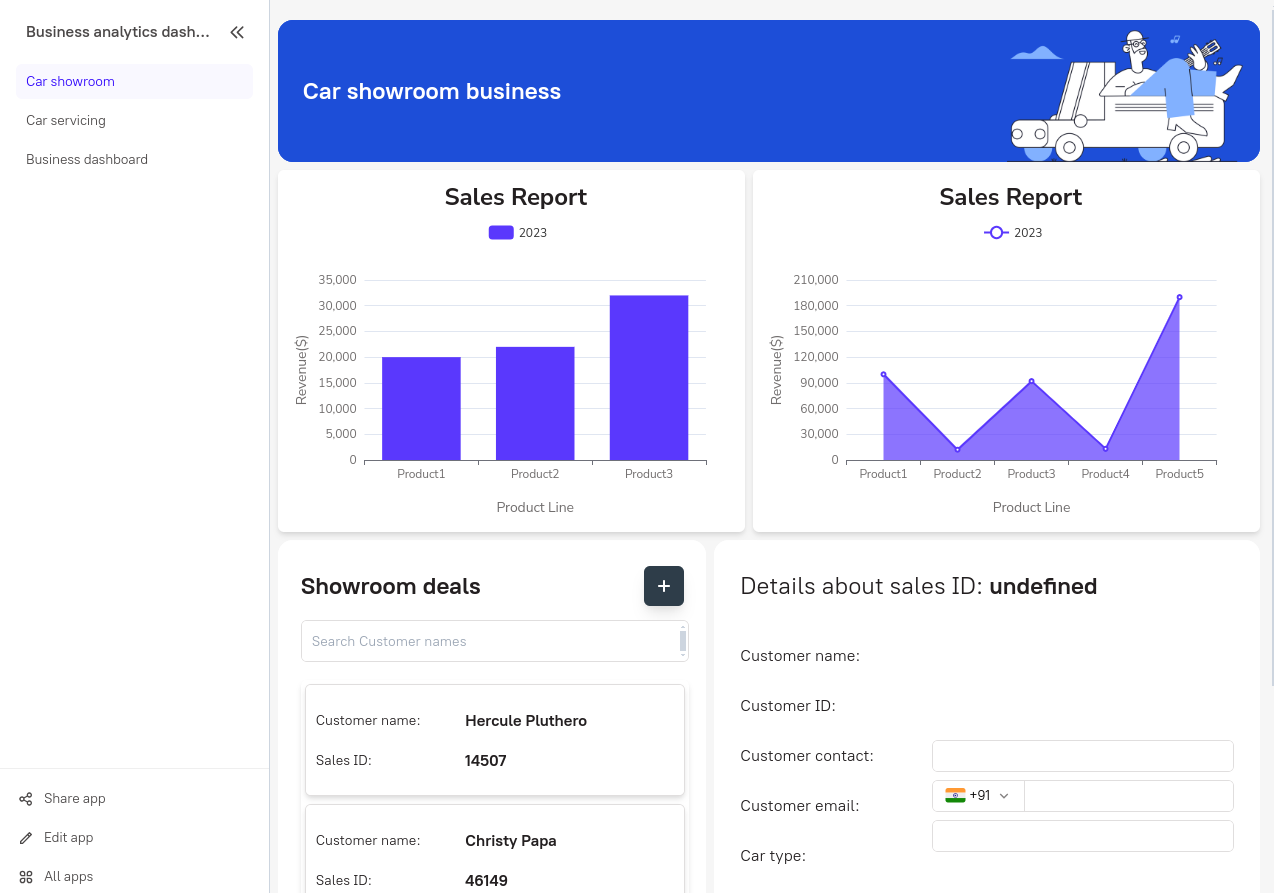
Creating a unique and beautiful dashboard doesn't have to be a daunting task. With the powerful combination of Laravel for managing data and AppSmith for designing the interface, you can achieve this quickly and effectively. Let's walk through the process together!
Step 1: Starting Your Project
To get started, you'll need to configure your Laravel project to support GraphQL, a tool that helps manage and organize your data efficiently. Think of it as setting up a solid foundation for your project. For more details, check out Laravel GraphQL Documentation.
type Query {
    sales: [Sale!]!
}
Action: Set up Lighthouse to support GraphQL in your Laravel project and define your GraphQL types and queries to manage data efficiently.
Step 2: Connecting AppSmith to Your Project
Next, set up AppSmith to connect to your Laravel project using GraphQL. This step allows AppSmith to seamlessly fetch the data it needs to display on your dashboard. You can follow the integration guide on AppSmith Documentation.
Example:
In AppSmith, you would configure a data source using your GraphQL endpoint and then create a query to fetch sales data:
{{
    fetchSales.run()
}}
Step 3: Building the Interactive DashboardDesign and Customization with AppSmith
What types of visualizations do you want? Charts, tables, or both?
Use AppSmith’s intuitive design tools to create dynamic charts and tables. For example, you can create a sales chart that shows monthly performance. These visual blocks make it easy to visualize your data in meaningful ways. Learn more about creating visualizations on AppSmith’s Chart Widgets.
{{
    const salesByMonth = fetchSales.data.reduce((acc, sale) => {
        const month = new Date(sale.created_at).getMonth() + 1;
        acc[month] = acc[month] ? acc[month] + 1 : 1;
        return acc;
    }, {});

    return Object.entries(salesByMonth).map(([month, count]) => ({
        x: `Month ${month}`,
        y: count
    }));
}}
Example: This code snippet processes the fetched sales data to aggregate sales counts by month, creating an array suitable for chart visualization.
Step 4: Advanced Features and Dynamic Filters
How do you want to filter your data? By date, customer, or other criteria?
Create filters in your dashboard that allow you to view specific data, such as sales within a certain date range or by a particular customer. This makes your dashboard more interactive and useful, providing deeper insights at a glance. For more advanced filtering techniques, visit GraphQL Filtering.
Example:
type Query {
    sales(startDate: String!, endDate: String!): [Sale!]!
}
Then, in AppSmith, you can dynamically set these parameters based on user inputs.

Conclusion
With these simple steps, you can create a dynamic and visually appealing dashboard using Laravel and AppSmith. You can display charts and tables that update automatically, with easy-to-use filters for more detailed views.
Now that you know how straightforward it is to build a stunning dashboard, what else would you like to try? Experiment with different color schemes, add interactive features, and explore more options to create a dashboard that informs and impresses.
Ready to create your next dashboard masterpiece? Talk now with us here.
Tags
Subscribe to
Our
Newsletter
Join 1,000+ people and recieve our weekly insights.

Success!
Thank your for subscribing to Buzzvel's
Newsletter, you will now
receive
amazing
tips
and insights weekly.


